Stillwater Real Estate Market Update
Welcome to my May 2024 update on the Stillwater, MN real estate market. In this edition, we’ll explore the latest trends and changes that have shaped the local real estate landscape, offering insights into what buyers and sellers can expect in the coming months.
Market Overview
This past month, Stillwater saw a slight decrease in new listings compared to the previous year, with 22 new listings in March 2024, marking a 15.4% drop. Despite this, closed sales have shown a robust increase, rising by 50% from 12 sales in March 2023 to 18 in March 2024. This dynamic suggests a competitive market where high demand continues to absorb available inventory swiftly.
Pricing Trends
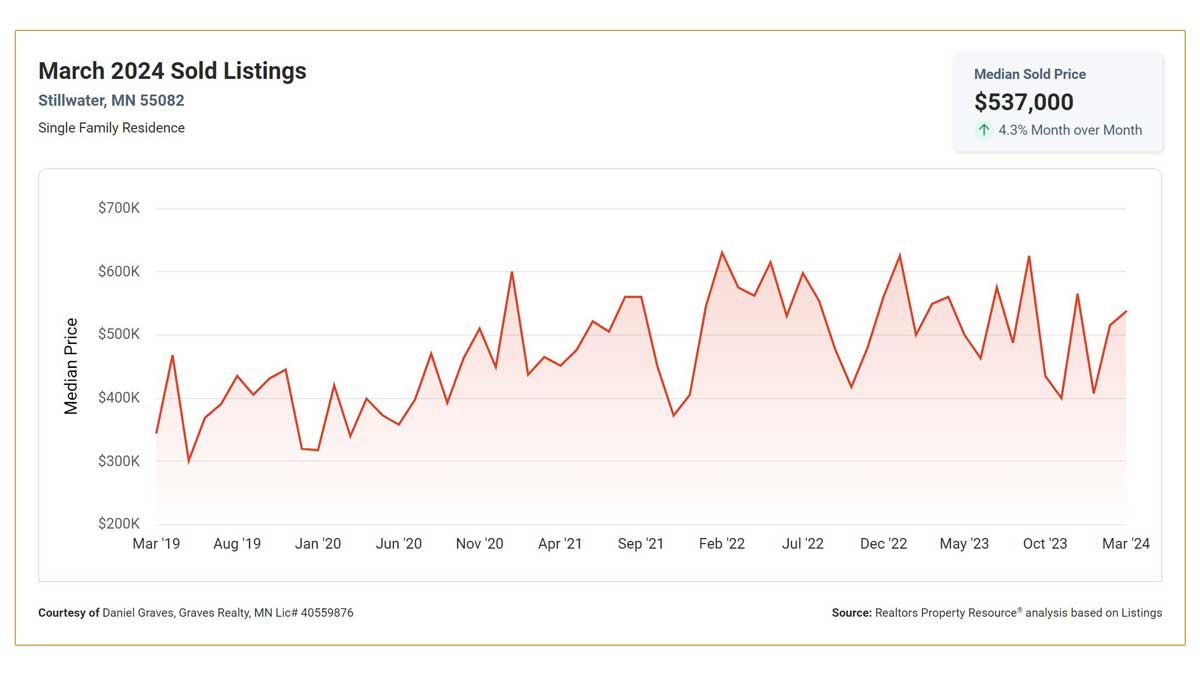
The median sales price in Stillwater has seen a noteworthy increase, climbing to $530,000 in March 2024, up from $485,950 in the previous year, a 9.1% rise. Similarly, the average sales price slightly increased by 1.3% to $537,194. The price per square foot also grew significantly, from $228 to $258, indicating a strong buyer willingness to pay premium prices for desirable properties.
Market Dynamics
The inventory of homes has seen an increase, rising by 24.3% to 46 homes available on the market. Correspondingly, the months’ supply of inventory rose significantly by 53.8%, from 1.3 months in March 2023 to 2.0 months in March 2024. This change reflects a slightly more balanced market, giving buyers more options than in the previous year. However, the days on the market until sale also increased to 69 days, up from 55, suggesting that while more homes are available, they are taking longer to sell.
New Listings Overview for March 2024:
| Detail | Data |
|---|---|
| Median List Price | $567,500 |
| Number of Properties | 32 |
| Median Living Area | 2,921 Sqft |
Active Listings Snapshot for March 2024:
| Detail | Data |
|---|---|
| Median List Price | $850,000 |
| Number of Properties | 45 |
| Median Living Area | 3,621 Sqft |
Buyer and Seller Behavior
The percentage of the original list price received by sellers slightly decreased to 98.6% from a flat 100%, showing that buyers are negotiating more aggressively than in the past. This trend could be indicative of buyers gaining leverage in negotiations as the market stabilizes.
Conclusion
The Stillwater real estate market is experiencing a mix of trends, with rising prices and an increasing inventory, presenting new opportunities and challenges for both buyers and sellers. As we move into the summer months, which traditionally see increased activity, it will be interesting to observe how these dynamics evolve. If you’re considering buying or selling in Stillwater, or just need more detailed information, don’t hesitate to contact me. Let’s discuss how you can best navigate this market!
FAQs
What is the best time of year to buy a house in Stillwater?
Traditionally, spring and early summer see the most activity, but with changing market dynamics, opportunities can arise at any time.
Are prices expected to continue rising in Stillwater?
While current trends show an increase in prices, market conditions can shift, influencing future pricing.
What does an increase in days on the market imply for buyers?
An increase in days on the market typically suggests that buyers have more negotiating power and a broader selection of homes to choose from.

