Stillwater, MN Real Estate Market Update (August 2023)

Are you ready to dive into the captivating world of Stillwater, Minnesota’s real estate market? Whether you’re a buyer or a seller, the statistics and trends we’re about to explore will provide you with invaluable insights to make informed decisions in this dynamic market. In this comprehensive Stillwater real estate market update, we’ll delve into the latest data, revealing key factors that can help you navigate the Stillwater real estate landscape.
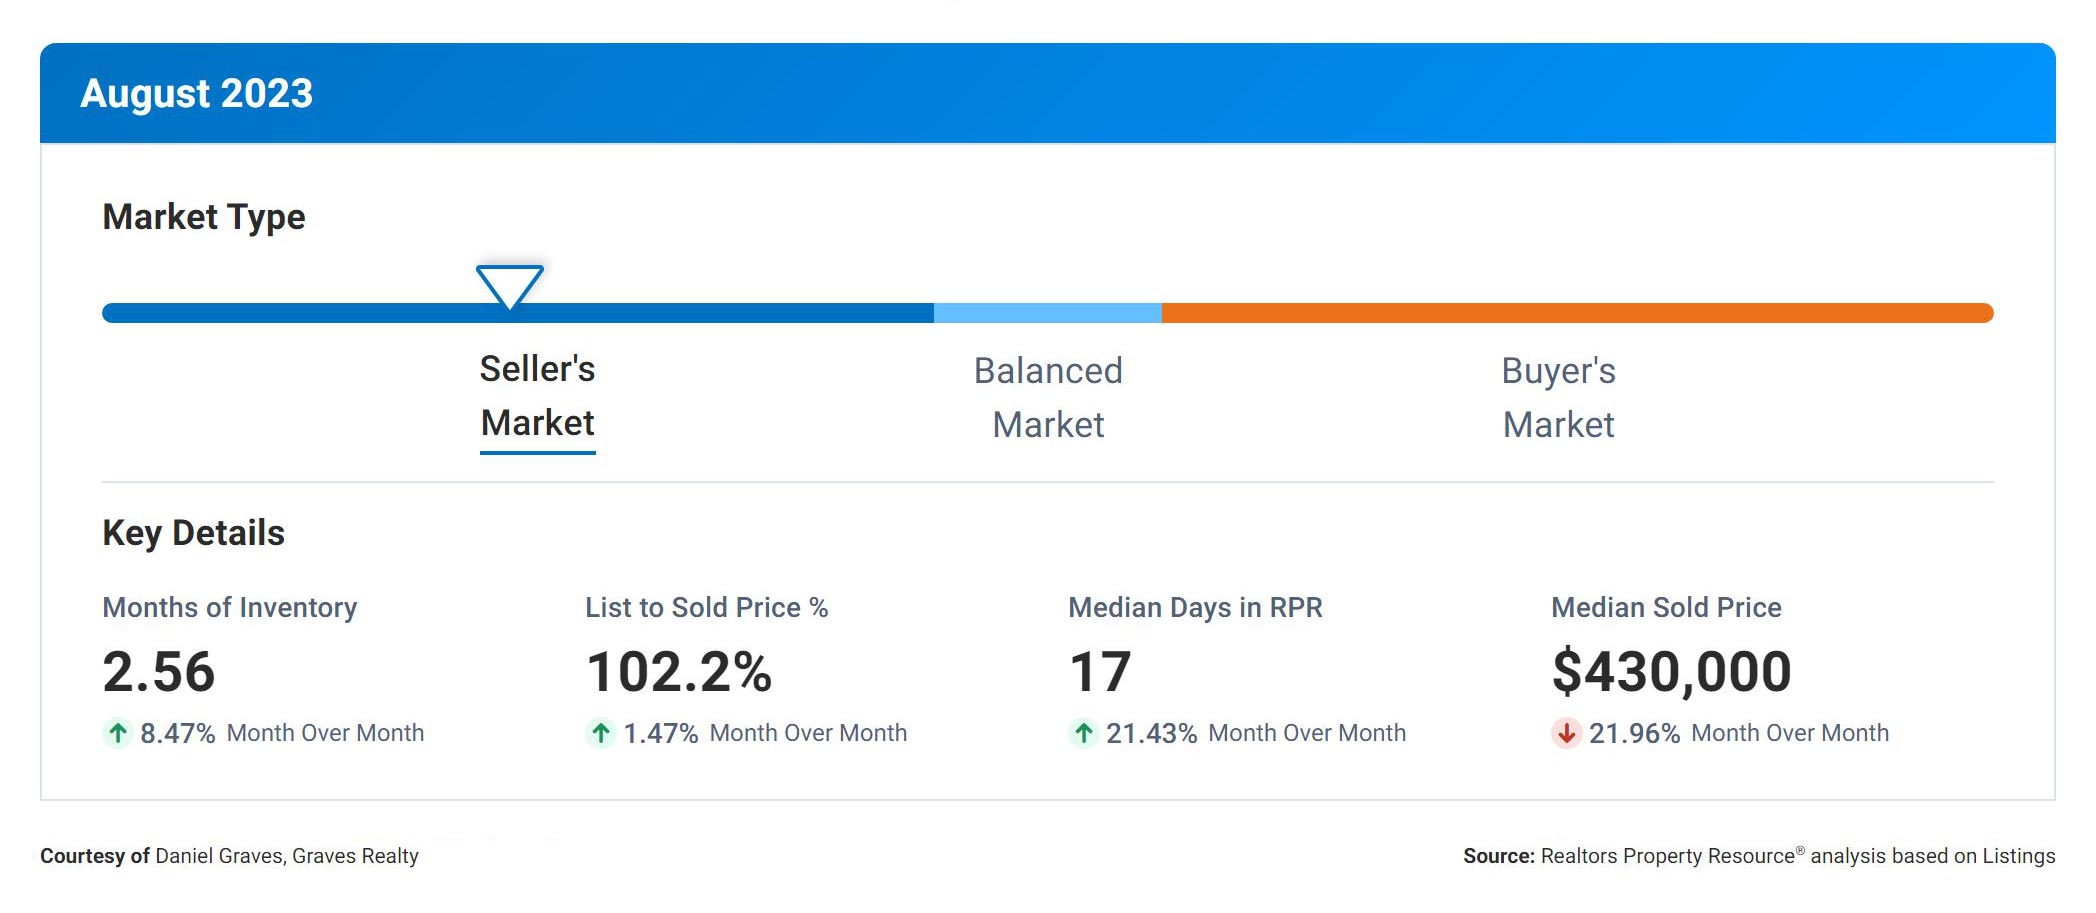
Months Supply of Inventory: 2.56 – A Seller’s Market
First, let’s look at the Months Supply of Inventory, a vital indicator of market conditions. Currently, it stands at an impressively low 2.56. This figure represents the number of months it would take to sell all the homes on the market if no new listings were added. A lower supply indicates a seller’s market, where demand surpasses availability. In this scenario, sellers hold a distinct advantage as buyers compete for a limited number of properties.
12-Month Change in Months of Inventory: A Notable 45.45% Increase
Now, here’s where it gets interesting. The 12-Month Change in Months of Inventory has experienced a substantial increase of 45.45% compared to the previous year. This means that, in the same period last year, it would have taken significantly fewer months to sell all available homes. This shift could potentially indicate a transition toward a more balanced or even a buyer’s market. Buyers, this might be your cue to celebrate!
Median Days Homes are On the Market: A Lightning-Fast 17 Days
Prepare to be amazed! The Median Days Homes are On the Market is a mere 17, which means that, on average, it takes just two weeks for a home to be sold once it hits the market. With homes selling at such a rapid pace, sellers can expect quick turnarounds and, quite possibly, multiple offers, making this an ideal market for sellers looking to make a move.
List to Sold Price Percentage: 102.2% – Sellers in the Lead
Now, let’s crunch some numbers. The List to Sold Price Percentage is a remarkable 102.2%. This percentage represents the average amount a home sells for compared to its original list price. In simpler terms, sellers are, on average, receiving slightly more than their asking price. This data underscores the eagerness of buyers to pay a premium to secure their dream home in the face of fierce competition.
Median Sold Price: A Strong $430,000
Lastly, we come to the Median Sold Price, which currently stands at an impressive $430,000. This figure represents the middle point of all sold prices in the market. It’s essential to clarify that this is not the average, but rather the price at which half of the homes sold above and half sold below. This data signals a robust market, with buyers willing to pay top dollar for their desired properties.
In Conclusion: A Dynamic Market with Opportunities for All
In conclusion, these real estate metrics paint an intriguing picture for the Stillwater Real Estate Market Update. The low Months Supply of Inventory and the Median Days Homes are On the Market indicate a highly competitive and fast-paced market that predominantly favors sellers. However, the significant increase in the 12-Month Change in Months of Inventory suggests a potential shift towards a more balanced or buyer-friendly market.
Moreover, the List to Sold Price Percentage exceeding 100% and the robust Median Sold Price demonstrate the willingness of buyers to invest generously in their dream homes. Whether you’re a buyer or a seller, these statistics provide valuable insights that can significantly inform your real estate decisions.
Remember, knowledge is power, and with these metrics at your disposal, you’re well-equipped to navigate the dynamic Stillwater real estate market. Happy buying and selling, everyone! Stay tuned for more updates as we continue to monitor this exciting market.
Click here to contact me with any questions.
Data source: www.narrpr.com

